It seems like most blogs have a post in them somewhere in which the blogger makes groveling apologies for neglecting it. This is one of those.
I pushed back from the blogging table a couple years ago as I became concerned that I was overwhelming students with too many posts (which were being assigned as course readings).
Then along came Trump and all the oxygen got sucked out of the daily news cycle. I didn't want to be constantly commenting on or fact-checking Trump, but I was nevertheless caught up in exactly that.
But now I am pushing past that and trying to get back on track. As part of that effort, I have established a Facebook page at https://www.facebook.com/ThinkingAboutIR This will constitute my frontpage, if you will, and I will be posting links to and comments on news items there.
This blog will continue to function as place for me to, as the name implies, think out loud about various issues in IR. In particular, I am going to be discussing the link between identity driven behavior and populism. Of course, other topics are likely to come up as well.
Monday, November 13, 2017

Wednesday, March 22, 2017
Innovation and Creative Destruction
Mark Perry recently has a useful post on the economics lessons from the demise of Gander Mountain. This post is particularly useful for explaining the ideas of creative destruction and consumer sovereignty.
How the mighty are fallen: Back in 2015, Mark Perry noted that only 12% of the 1955 Fortune 500 companies were still on the list in 2015. He gives American Motors, Brown Shoe, Studebaker, Collins Radio, Detroit Steel, Zenith Electronics, and National Sugar Refining as examples of corporations that were on the list in 1955 but in 2015. Newcomers to the list since 1955 include Facebook, eBay, Home Depot, Microsoft, Google, Netflix, Office Depot and Target.
Innovation and Growth: In another AEI blog, James Pethokoukis reports on research by Leonid Kogan, Demitris Papanikolaou, Amit Seru, and Noah Stoffman that measures innovation in terms of patents issued to companies from 1926 to 2010 and the stock market response to those patents. The combination gives the a way to measure the economic significance of the innovation contained in the patent.
Creative Destruction: The face of innovation only an economist could love: All the above is fine and good, but it should be obvious that creative destruction is destruction nonetheless and the creativity of it is probably lost on the people having their livelihoods destroyed.
How the mighty are fallen: Back in 2015, Mark Perry noted that only 12% of the 1955 Fortune 500 companies were still on the list in 2015. He gives American Motors, Brown Shoe, Studebaker, Collins Radio, Detroit Steel, Zenith Electronics, and National Sugar Refining as examples of corporations that were on the list in 1955 but in 2015. Newcomers to the list since 1955 include Facebook, eBay, Home Depot, Microsoft, Google, Netflix, Office Depot and Target.
Innovation and Growth: In another AEI blog, James Pethokoukis reports on research by Leonid Kogan, Demitris Papanikolaou, Amit Seru, and Noah Stoffman that measures innovation in terms of patents issued to companies from 1926 to 2010 and the stock market response to those patents. The combination gives the a way to measure the economic significance of the innovation contained in the patent.
Creative Destruction: The face of innovation only an economist could love: All the above is fine and good, but it should be obvious that creative destruction is destruction nonetheless and the creativity of it is probably lost on the people having their livelihoods destroyed.
Monday, April 11, 2016
China's Currency Today
When it comes to China's currency, and their supposed manipulation of it, you've got to keep on top of changing mid-term circumstances and policies. That is to say, what was true a couple years ago may not be true today.
In a past post, which I assigned to several iterations of IPE students, I focused on research from around 2014 that was itself largely focused on the 2012 political debate about Chinese currency manipulation. To my mind, the most interesting factoid there was Gagnon's finding that, while China had been manipulating the value of the RMB after moving to a crawling peg, the large purchases of T-bills that kept the value of the Yuan down had largely stopped in 2011. In other words, by the time Mit Romney was complaining about China's manipulation, the Chinese had already changed their behavior.
Unfortunately, the political debate has not caught up to that reality in the past four years, even while the reality has been changing even further. Indeed, David Goldman invoke Alice in Wonderland imagery in describing the political rhetoric in his column "Alice in Trumperland and China’s currency." (Note: if you are one of my IPE students, you really need to read this article in its entirety.)
Where Gagnon had to dig down into the data on monthly purchases of T-bills to discover China's change in behavior in 2011, Goldman needs only to look at broader measures to see the situation in 2016. Goldman notes the following:

Note that from 2002-2008, the Dollar was generally declining in value and, therefore, pegging the RMB to the Dollar meant riding down with the US exchange rate. This meant that the Dollar was not devaluing against the RMB as much as it was against other currencies while at the same time essentially devaluing the RMB against those currencies
However, thing look very different since 2014. The Dollar has shot up in value in the past few years and the Chinese have, apparently to their detriment, not only gone along for the ride, but worked at keeping up. These efforts may be deemed "currency manipulation" but it has been manipulation that has prevented a devaluing of the RMB versus the Dollar (in other words, the opposite of what they would do to maximize exports to the US).
Indeed, if the RMB was fully floating, it would probably have dropped in value versus the Dollar as the latter jumped up in value in 2014. For this reason, one might claim the the RMB is currently overvalued. Again, this is the opposite of what US critics of China claim.
Postscript: Goldman's column alluded to Donald Trump in the title, but the body focused on a talk radio host attacking Cruz. However, Trump does make the standard currency manipulation charges against China in this Op-Ed from November 2015 (reprinted this April). What strikes me when I read it is that the language might be straight out of something written in 2012, including the vague reference to economists estimating that the Yuan is undervalued 15-40%. This runs counter to the tenor of most current commentary about the government trying to prop up the RMB.
Interestingly enough, the top result Google news search for "China Currency" turns an article in Barron's entitled "Sorry, Trump, but Chinese Currency Is Actually Way Overvalued", with a subtitle of "Amid other bizarre episodes, allegations of China’s cheapening of its currency remain contrary to facts." (Note: This article largely relies on Goldman's column for its content.)
In a past post, which I assigned to several iterations of IPE students, I focused on research from around 2014 that was itself largely focused on the 2012 political debate about Chinese currency manipulation. To my mind, the most interesting factoid there was Gagnon's finding that, while China had been manipulating the value of the RMB after moving to a crawling peg, the large purchases of T-bills that kept the value of the Yuan down had largely stopped in 2011. In other words, by the time Mit Romney was complaining about China's manipulation, the Chinese had already changed their behavior.
Unfortunately, the political debate has not caught up to that reality in the past four years, even while the reality has been changing even further. Indeed, David Goldman invoke Alice in Wonderland imagery in describing the political rhetoric in his column "Alice in Trumperland and China’s currency." (Note: if you are one of my IPE students, you really need to read this article in its entirety.)
Where Gagnon had to dig down into the data on monthly purchases of T-bills to discover China's change in behavior in 2011, Goldman needs only to look at broader measures to see the situation in 2016. Goldman notes the following:
- The RMB's real effective exchange rate has gone up 40% since 2008. (Note: This is not the Yuan/Dollar rate but the rather the rate of exchange between the Yuan and a basket of currencies.)
- Since 2008, the annual growth in US imports from China has dropped dramatically since 2008.
- The trade weighted value of the Dollar has risen over 25% since 2014 while the Yaun/Dollar rate has fallen slightly. This is what dragged the value of the RMB up so much against the other currencies in the world.
- Chinese refusal to let the RMB fall (more) vs the Dollar correlated with later drops in Chinese exports. China also had to maintain high domestic interest rates to keep up with the Dollar's rise.

Note that from 2002-2008, the Dollar was generally declining in value and, therefore, pegging the RMB to the Dollar meant riding down with the US exchange rate. This meant that the Dollar was not devaluing against the RMB as much as it was against other currencies while at the same time essentially devaluing the RMB against those currencies
However, thing look very different since 2014. The Dollar has shot up in value in the past few years and the Chinese have, apparently to their detriment, not only gone along for the ride, but worked at keeping up. These efforts may be deemed "currency manipulation" but it has been manipulation that has prevented a devaluing of the RMB versus the Dollar (in other words, the opposite of what they would do to maximize exports to the US).
Indeed, if the RMB was fully floating, it would probably have dropped in value versus the Dollar as the latter jumped up in value in 2014. For this reason, one might claim the the RMB is currently overvalued. Again, this is the opposite of what US critics of China claim.
Postscript: Goldman's column alluded to Donald Trump in the title, but the body focused on a talk radio host attacking Cruz. However, Trump does make the standard currency manipulation charges against China in this Op-Ed from November 2015 (reprinted this April). What strikes me when I read it is that the language might be straight out of something written in 2012, including the vague reference to economists estimating that the Yuan is undervalued 15-40%. This runs counter to the tenor of most current commentary about the government trying to prop up the RMB.
Interestingly enough, the top result Google news search for "China Currency" turns an article in Barron's entitled "Sorry, Trump, but Chinese Currency Is Actually Way Overvalued", with a subtitle of "Amid other bizarre episodes, allegations of China’s cheapening of its currency remain contrary to facts." (Note: This article largely relies on Goldman's column for its content.)
Thursday, April 07, 2016
Unusually Good Column on the US Trade Deficit
Steve Chapman wrote an unusually well informed column for the Chicago Tribune, "What Donald Trump and Bernie Sanders don't get about the causes of our trade deficit."
Most of Chapman's column rehearses the argument that the US trade deficit is driven by the US capital account surplus. He couches this in terms of Trumps frequent lament that the US "doesn't win anymore" and that the trade deficit is one example of the US losing. Chapman points out that the trade deficit is a result of a capital or investment surplus and is, therefore, evidence of the US winning with regard to attract foreign investment. He notes:
Most of Chapman's column rehearses the argument that the US trade deficit is driven by the US capital account surplus. He couches this in terms of Trumps frequent lament that the US "doesn't win anymore" and that the trade deficit is one example of the US losing. Chapman points out that the trade deficit is a result of a capital or investment surplus and is, therefore, evidence of the US winning with regard to attract foreign investment. He notes:
The little-known secret of international commerce is that foreigners can't invest more here than we invest abroad unless they also sell us more than we sell them. This is not a matter of academic theory. It's a matter of accounting.The late economist Herbert Stein wrote the entry on "balance of payments" in "The Concise Encyclopedia of Economics." "A deficit in the current account is always" — always — "accompanied by an equal surplus in the capital account, and vice versa," he noted.Confronting that simple fact means recognizing that the trade deficit is merely the flip side of a healthy phenomenon. If no one wanted to invest here, we'd be running a trade surplus — and we'd regret it.
Thursday, January 07, 2016
US Voters: Economic Anxiety and Political Anger
Politico Magazine had an interesting op-ed a month ago entitled "Why Bernie Sanders Can't Win." In it, Daley, Cowan, and Hatalsky of the Third Way (a centrist think tank) argued that, based on their surveys and focus groups of voters, Bernie Sander's populist stance wasn't going to win most of those voters.
What I found interesting was Daley, Cowan and Hatalsky's diagnosius of swing voters' view on the economy. They found that voters were more anxious than angry about the economy. Where Sanders and Occupy-esque activist are trying to stoke anger about the economy being rigged to favor the so-called 1%, swing voters don't see the economy as rigged against them. Instead they are anxious about the qualitative changes that have occured in how the economy works. As the authors put it:
Of course, this begs the question of why politicians aren't equally prescient.
What I found interesting was Daley, Cowan and Hatalsky's diagnosius of swing voters' view on the economy. They found that voters were more anxious than angry about the economy. Where Sanders and Occupy-esque activist are trying to stoke anger about the economy being rigged to favor the so-called 1%, swing voters don't see the economy as rigged against them. Instead they are anxious about the qualitative changes that have occured in how the economy works. As the authors put it:
So what are middle-class voters looking for in an economic platform? An agenda that makes these huge, scary economic forces work for the middle class, not against them. When Kodak went under, 145,000 jobs disappeared—not because of unfairness but because we take pictures on our iPhones. Airbnb was just a twinkle in someone’s eye five years ago. Next year, it will serve more visitors than the entire Hilton chain but employ fewer people than North Dakota has hotel desk clerks. Borders Books has all but disappeared because of the Kindle; 300,000 sales jobs have vanished thanks to Amazon. People live in this world; they’re part of it, and they know it’s not because a handful of rich guys are pulling the strings.
Since that is the world voters see, the main populist economic ideas seem aimed at the wrong targets and tethered to a different time. Expand Social Security for everyone? That would cost trillions and confer a huge share of its benefits to wealthy, married senior couples. Single-payer health care? That comes with a $15 trillion price tag, a giant increase in middle class taxes, and another huge government program. Doubling the minimum wage to $15? All Democrats want to raise it, but a bump of nearly $8 nationwide would cost far too many jobs. All told, core populist policies would increase taxes on someone earning $60,000 by over five thousand dollars. And not a single one of these ideas addresses the middle class anxieties that are driven by the modern economy.
That’s why populist economic policies may poll well in the abstract, but most voters feel they do little to address their own concerns. In our focus groups, they felt that the populist proposals simply were not relevant to their own lives. Over and over, we heard variations on this: “Democrats are for the poor; Republicans are for the rich. No one fights for the middle class.” And tellingly, though every voter in our groups supported raising the minimum wage, not a single one thought it would directly help them or their family.
If voters believe the biggest challenge they face is navigating a new economy, then Democrats must have an agenda to meet that challenge. Voters know we can’t go back to the way things were. As one female swing voter from the Northeast said it, “I do not think we will ever ‘recover’ to the same place or economy we were before.” A male swing voter from Virginia described it this way: “The printing industry is not going to be what it’s going to be anymore, and soon everybody starts moving towards something else, transitioning towards something else, the better it’s going to be.”
American voters see a brave new economic world. They want a real path to the skills, jobs, and wages they need to succeed, and a modern set of policy ideas made for this irreversible age of globalization and technological change.The authors move on to analyze Democratic electoral chances but I think the above paragraphs lay out an interesting diagnosis of voter views. It is interesting because the views described by the authors are exactly the views I would say voters should have based on everything I know about the modern global economy. So, if the authors' analysis is correct, voters appear to be fairly prescient.
Of course, this begs the question of why politicians aren't equally prescient.
Monday, October 05, 2015
Factoid: US Manufacturing (Again)
Apparently, Oct 2 was Manufacturing Day in the US and Mark Perry took the opportunity to push his recurring theme of enduring US manufacturing strength. In his post, Perry updated his graph of US manufacturing output and employment (below). I have shared previous editions of this graph with my students, so here is the updated one.

In general, the story remains the same. US manufacturing output grew dramatically in the late 1990s and early 2000s while employment in the sector dropped just as dramatically. Of course, the Great Recession put a hurt on the sector but it has largely recovered (though it is not growing like it did in the beginning of the century).
As always, Perry makes the argument that having less people making more stuff is good and has a graph showing the rising worker productivity in the sector (below). The graph shows that worker productivity in the manufacturing sector more than doubled in the 13 years from 1997 to 2010. Note that the previous doubling took 42 years from 1955 to 1997. The point to be taken here is that US manufacturing workers have been improving their competitive edge on foreign workers through productivity increases which render simple comparisons of US and foreign wages meaningless.

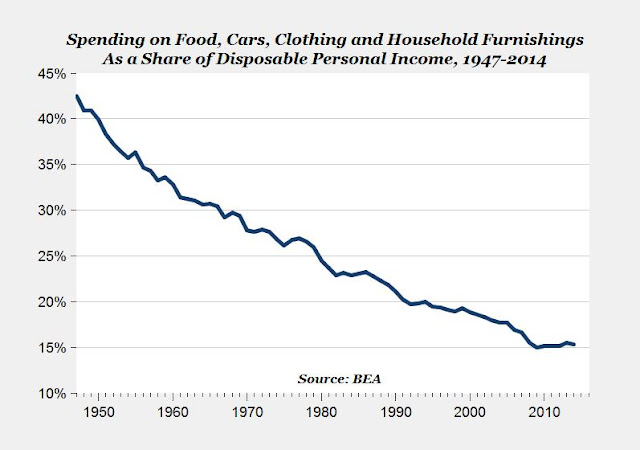
However, the bigger story is in the graph on US spending on food, cars, clothing and household furnishings (i,e,, stuff we buy). Whereas US consumers spent over 40% of their disposable income on such stuff in 1950, today they spend just over 15% on it today. Perry sees two things going on here: "As US manufacturing has become more technologically advanced and efficient, the price of manufactured durable goods has fallen in relation to both: a) other consumer products and services, and b) Americans’ after-tax disposable personal income." Or, as I like to say, stuff is cheap nowadays.
 Fair enough, but it is important to remember that price depends not just on the ability to supply stuff (i.e., the technology and efficiency of the manufacturing sector) but also on demand for stuff in general. While all of us consume more stuff than our parents did, we consume many things that aren't physical stuff at all. The price of all my TVs pales in comparison to my accumulated payments to Direct TV, as does the price of my smartphone to the cost of the service contract that came with it. And don't get me started with what I spend on healthcare.
Of course, Perry recognizes this when he includes the relative price of "other consumer products and services", but he is potentially missing growing demand for these things. Where innovation once meant building a better mousetrap (something that would be manufactured), it now more often means designing a better app (which is not manufactured in the traditional sense). Therefore. making physical stuff may not be the economic be-all and end-all it used to be.

In general, the story remains the same. US manufacturing output grew dramatically in the late 1990s and early 2000s while employment in the sector dropped just as dramatically. Of course, the Great Recession put a hurt on the sector but it has largely recovered (though it is not growing like it did in the beginning of the century).
As always, Perry makes the argument that having less people making more stuff is good and has a graph showing the rising worker productivity in the sector (below). The graph shows that worker productivity in the manufacturing sector more than doubled in the 13 years from 1997 to 2010. Note that the previous doubling took 42 years from 1955 to 1997. The point to be taken here is that US manufacturing workers have been improving their competitive edge on foreign workers through productivity increases which render simple comparisons of US and foreign wages meaningless.

However, the bigger story is in the graph on US spending on food, cars, clothing and household furnishings (i,e,, stuff we buy). Whereas US consumers spent over 40% of their disposable income on such stuff in 1950, today they spend just over 15% on it today. Perry sees two things going on here: "As US manufacturing has become more technologically advanced and efficient, the price of manufactured durable goods has fallen in relation to both: a) other consumer products and services, and b) Americans’ after-tax disposable personal income." Or, as I like to say, stuff is cheap nowadays.
 Fair enough, but it is important to remember that price depends not just on the ability to supply stuff (i.e., the technology and efficiency of the manufacturing sector) but also on demand for stuff in general. While all of us consume more stuff than our parents did, we consume many things that aren't physical stuff at all. The price of all my TVs pales in comparison to my accumulated payments to Direct TV, as does the price of my smartphone to the cost of the service contract that came with it. And don't get me started with what I spend on healthcare.
Of course, Perry recognizes this when he includes the relative price of "other consumer products and services", but he is potentially missing growing demand for these things. Where innovation once meant building a better mousetrap (something that would be manufactured), it now more often means designing a better app (which is not manufactured in the traditional sense). Therefore. making physical stuff may not be the economic be-all and end-all it used to be.
Factoid: WB Predicts Poverty Below 10%
The World Bank is predicting that the proportion of the world's population living in extreme poverty will drop to 9.6% by the end of 2015. As they put it:
The WB's press release is a bit awkward, so you might want to see the BBC's summary of the report.
While poverty is decreasing in all regions, the WB's report notes that the concentration of poverty has shifted from East Asia to Sub-Saharan Africa. In their words:
The Bank uses an updated international poverty line of US $1.90 a day, which incorporates new information on differences in the cost of living across countries (the PPP exchange rates). The new line preserves the real purchasing power of the previous line (of $1.25 a day in 2005 prices) in the world’s poorest countries. Using this new line (as well as new country-level data on living standards), the World Bank projects that global poverty will have fallen from 902 million people or 12.8 per cent of the global population in 2012 to 702 million people, or 9.6 per cent of the global population, this year.
The WB's press release is a bit awkward, so you might want to see the BBC's summary of the report.
While poverty is decreasing in all regions, the WB's report notes that the concentration of poverty has shifted from East Asia to Sub-Saharan Africa. In their words:
For the last several decades, three regions, East Asia and Pacific, South Asia, and Sub-Saharan Africa, have accounted for some 95 percent of global poverty. Yet, the composition of poverty across these three regions has shifted dramatically. In 1990, East Asia accounted for half of the global poor, whereas some 15 percent lived in in Sub-Saharan Africa; by 2015 forecasts, this is almost exactly reversed: Sub-Saharan Africa accounts for half of the global poor, with some 12 percent living in East Asia. Poverty is declining in all regions but it is becoming deeper and more entrenched in countries that are either conflict ridden or overly dependent on commodity exports.Of course, the underlying story here is that the economic growth in China and India has moved hundreds of millions of people out of extreme poverty in the past decades while not much has stirred in Africa.
Subscribe to:
Posts (Atom)