In general, the story remains the same. US manufacturing output grew dramatically in the late 1990s and early 2000s while employment in the sector dropped just as dramatically. Of course, the Great Recession put a hurt on the sector but it has largely recovered (though it is not growing like it did in the beginning of the century).
As always, Perry makes the argument that having less people making more stuff is good and has a graph showing the rising worker productivity in the sector (below). The graph shows that worker productivity in the manufacturing sector more than doubled in the 13 years from 1997 to 2010. Note that the previous doubling took 42 years from 1955 to 1997. The point to be taken here is that US manufacturing workers have been improving their competitive edge on foreign workers through productivity increases which render simple comparisons of US and foreign wages meaningless.
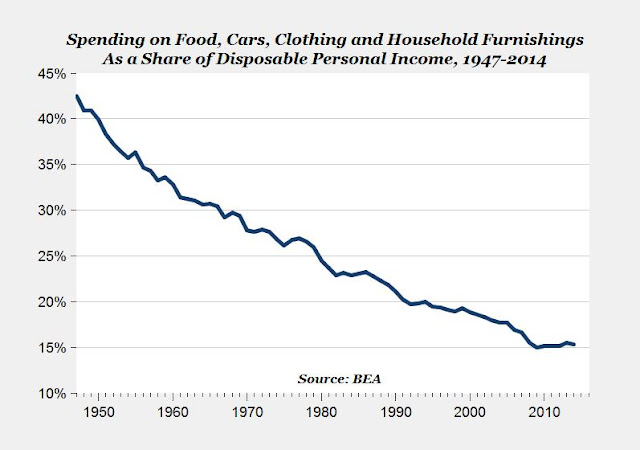
However, the bigger story is in the graph on US spending on food, cars, clothing and household furnishings (i,e,, stuff we buy). Whereas US consumers spent over 40% of their disposable income on such stuff in 1950, today they spend just over 15% on it today. Perry sees two things going on here: "As US manufacturing has become more technologically advanced and efficient, the price of manufactured durable goods has fallen in relation to both: a) other consumer products and services, and b) Americans’ after-tax disposable personal income." Or, as I like to say, stuff is cheap nowadays.
 Fair enough, but it is important to remember that price depends not just on the ability to supply stuff (i.e., the technology and efficiency of the manufacturing sector) but also on demand for stuff in general. While all of us consume more stuff than our parents did, we consume many things that aren't physical stuff at all. The price of all my TVs pales in comparison to my accumulated payments to Direct TV, as does the price of my smartphone to the cost of the service contract that came with it. And don't get me started with what I spend on healthcare.
Of course, Perry recognizes this when he includes the relative price of "other consumer products and services", but he is potentially missing growing demand for these things. Where innovation once meant building a better mousetrap (something that would be manufactured), it now more often means designing a better app (which is not manufactured in the traditional sense). Therefore. making physical stuff may not be the economic be-all and end-all it used to be.

